
I have been merrilly using NCrunch – an “automated concurrent testing tool for Visual Studio” – for almost three years now. I ponied up for a paid license when it made the transition from beta to RTM, and I recently shelled out again for an upgrade to version 2.
Why?! Why do this when plenty of test runners are free, or bundled with software I already own such as ReSharper and Visual Studio itself?
To answer that question I sorely wanted to write another “list post” as a follow-up to 12 Reasons Why I Love Unit Tests but as my draft progressed and my thoughts crystallised in front of me on the screen, I realised that all of the points I was trying to convey ultimately boil down to the same one reason:
NCrunch Saves Me Time
I missed out on the age of the punchcard, thank goodness. I don’t think I could have coped with the torpid feedback cycles that software developers of that era had to endure. Bob Martin describes the multi-day process entertainingly in his excellent book The Clean Coder – programs written on coding forms with a #2 pencil, typed up by key-punchers, desk-checked, loaded by the computer operators, and ultimately returned wrapped in a rubber band with a printout showing a compile error. It must have been utterly soul-destroying.
Despite having started my own software development career a couple of decades after the use of punchcards died out, I have still been witness to several advancements that have reduced feedback cycle time, enabling complex yet high-quality systems to be developed and enhanced in a fraction of the time that was once possible. I’m thinking of techniques such as static code analysis, continuous integration, continuous delivery and of course the widespread adoption of automated testing.
NCrunch Facilitates the TDD Discipline
Done well, Test-Driven Development is a powerful, professional, technique that allows us to develop and maintain solid, clean code in a short time. But without the right tooling to support this process, TDD can feel painful, too much stop-start while we wait on the compiler or test runner, especially if we are deliberately using baby-step techniques such as “Fake It Till You Make It” or “Stair-Step Tests”. Consider the steps we might typically intend to take:
- Write a test that doesn’t compile.
- Try to compile the code.
- Write a stub member to make the test compile.
- Compile
- Run the tests and watch them fail.
- Fake the result.
- Compile
- Run the tests and watch them pass.
- Add a second test to force the code to fail again.
- Compile
- Run the tests and watch them fail.
- Add a more general implementation of the code.
- Compile
- Run the tests and watch them pass.
- Refactor
- Compile
- Run the tests and watch them pass.
Is it any wonder that we are tempted to cut corners when it comes to TDD?!
But consider what this process is like when the tooling does all the grunt work and context-switching for you in the background:
- Write a test that doesn’t compile.
- Write a stub member to make the test compile.
- Fake the result.
- Add a slightly more specific test to force the code to fail again.
- Add a more general implementation of the code.
- Refactor
We are left with just the “interesting” steps, and the TDD process now flows naturally and instinctively. The IDE takes responsibility for constantly compiling and testing the code, and corners are less likely to be cut.
I love this process. I like to make use of the big inexpensive monitors that the twenty-first century has blessed us with. I open up a window for the tests, another for the system under test, and one each for the NCrunch Tests and NCrunch Processing Queue windows – and then I have all I need on a single screen to code tight, well-tested, code at a quick pace:
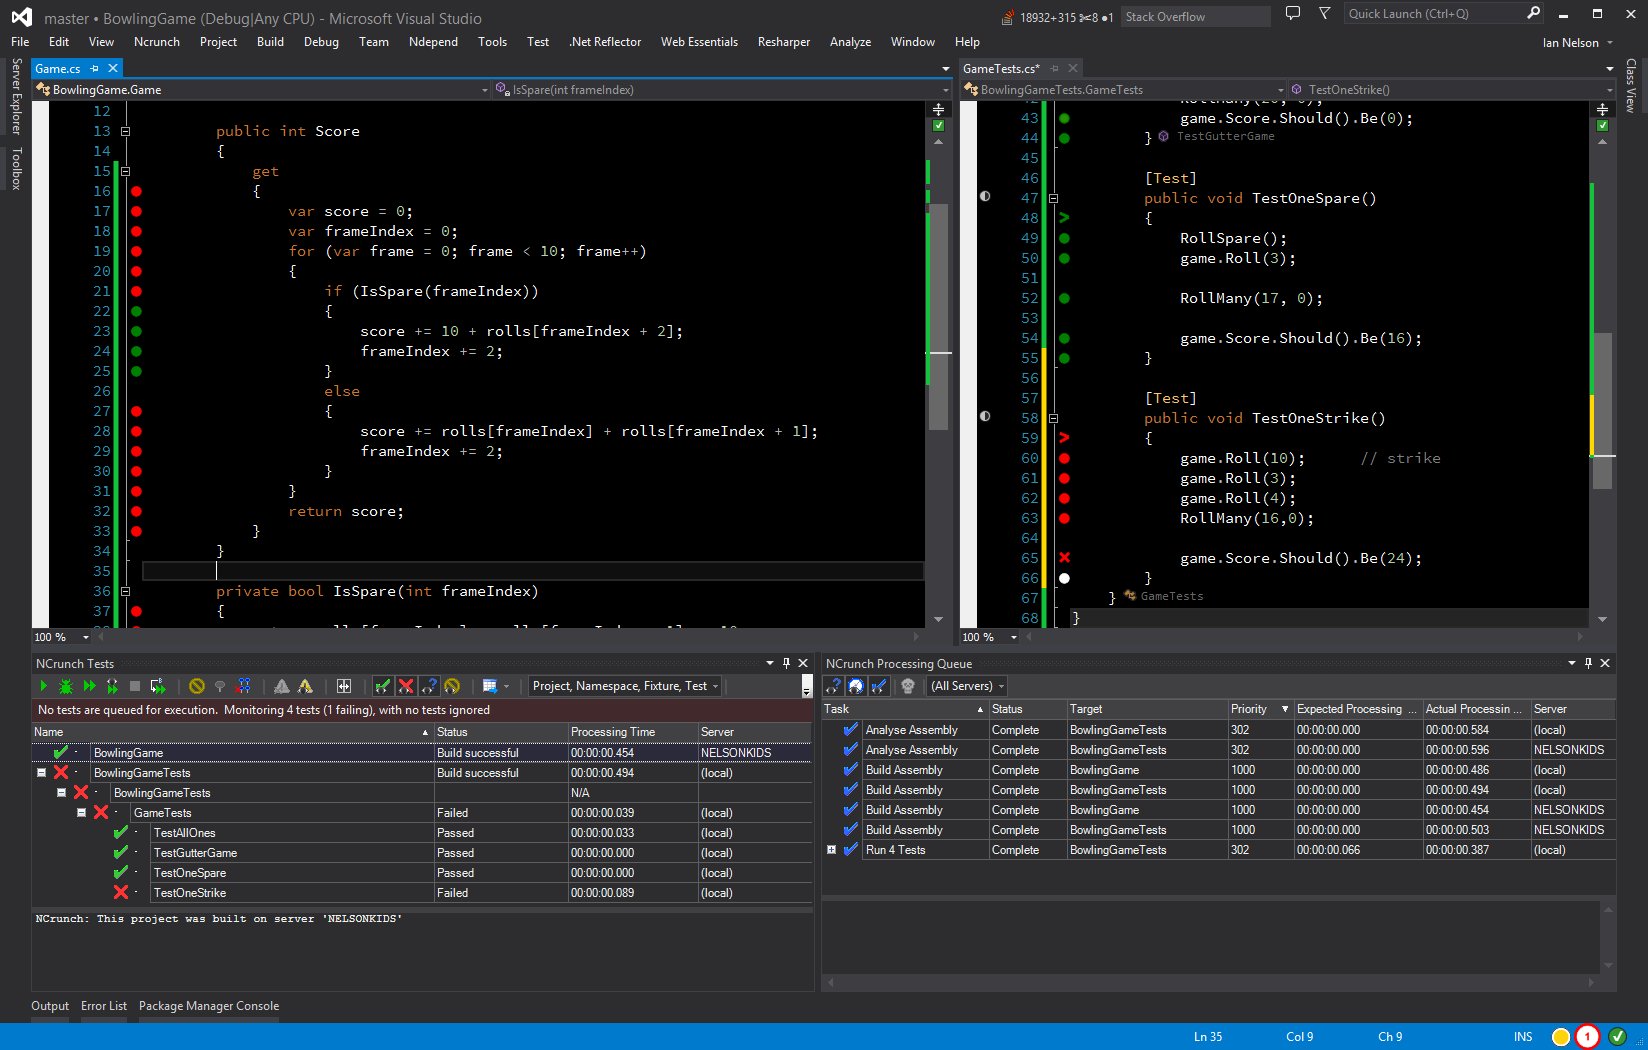
For me it is this – the facilitation of TDD and the instant feedback – that is the killer benefit of NCrunch. The remaining features that I mention below are merely the icing on the cake, but they do all serve to save me time.
NCrunch Puts Real-Time Code-Coverage Data In My Face
Time was, we would gather test coverage metrics using tools like NCover or dotCover, perhaps running as part of a CI build on the server. Once in a while someone might even deem it worthwhile having a look at the output!
With NCrunch, the code coverage is displayed right there in the IDE on a line-by-line basis as you code, with any uncovered lines sticking out like a sore thumb.

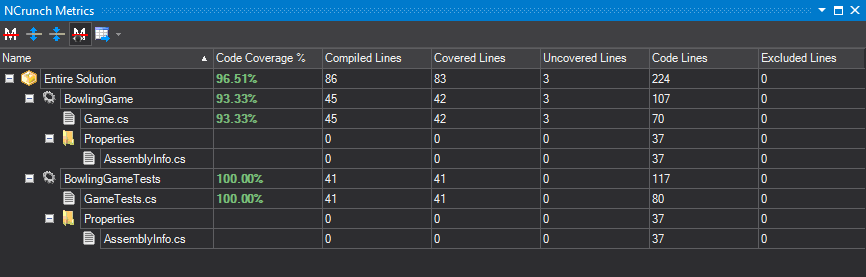
If you really want to see overall metrics for the solutions, NCrunch also provides a separate Metrics window.
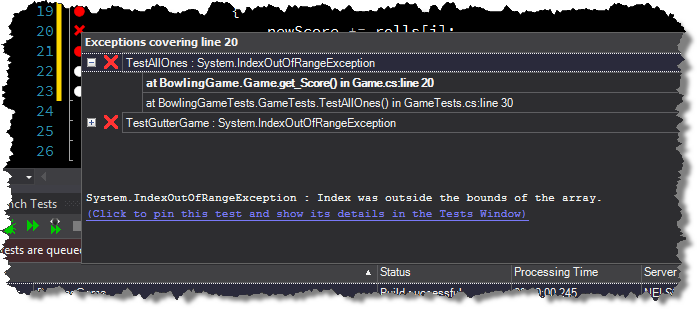
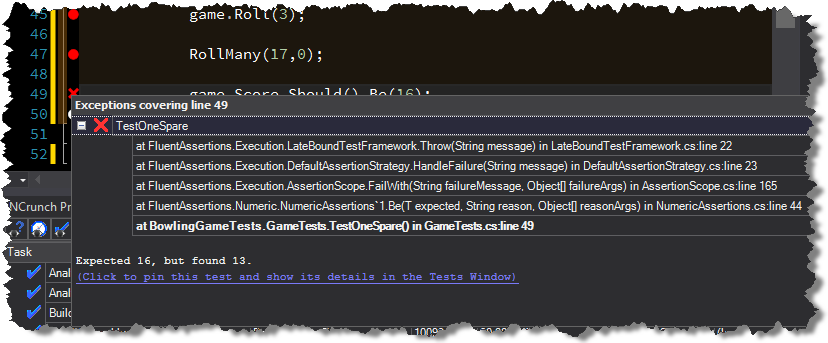
NCrunch Doesn’t Make Me Hunt For Error Messages
When my code fails a test assertion, or even when it fails to compile, the reasons, just like the code-coverage data, are right there in my face, almost immediately. I don’t have to go hunting for the problem, I can access the compiler errors or stack traces for failed assertions without leaving the window in which I’m coding.
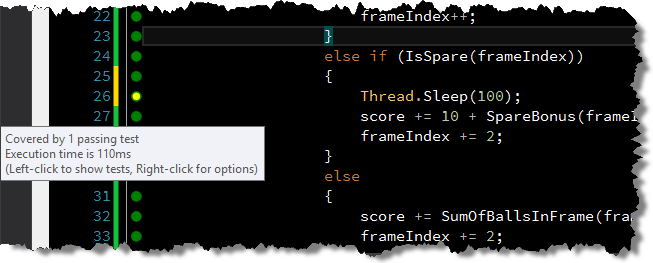
NCrunch Highlights Slow-Running Lines of Code
Powerful, expensive performance profiling tools such as Redgate Ants Performance Profiler and JetBrains dotTrace are often used to find bottlenecks in code that has already been developed and is often in production.
NCrunch, as a somewhat unsung benefit, almost absent-mindedly gathers performance metrics as it continuously executes my tests, and highlights slow lines of code with a different coloured marker.
Given the existence of appropriate tests, this means that my attention is drawn to potential problems before the code is even committed to the source control repository.
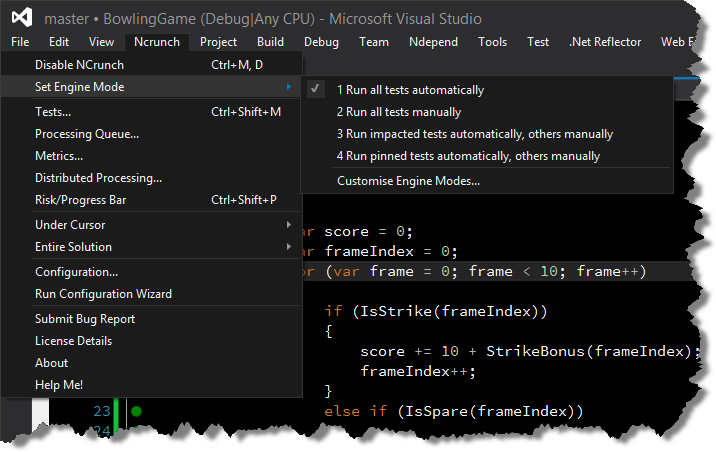
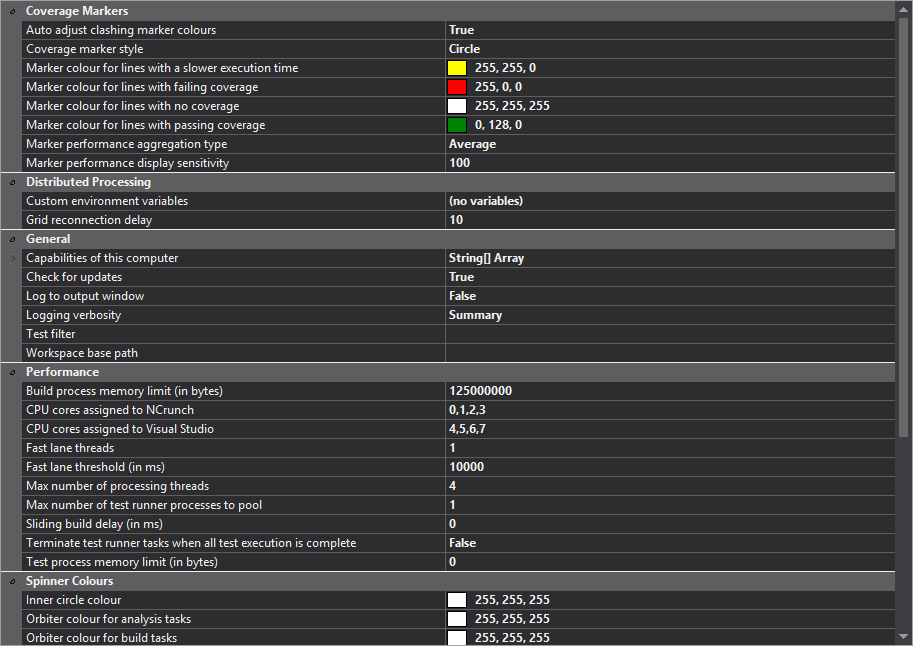
NCrunch is Super-Configurable
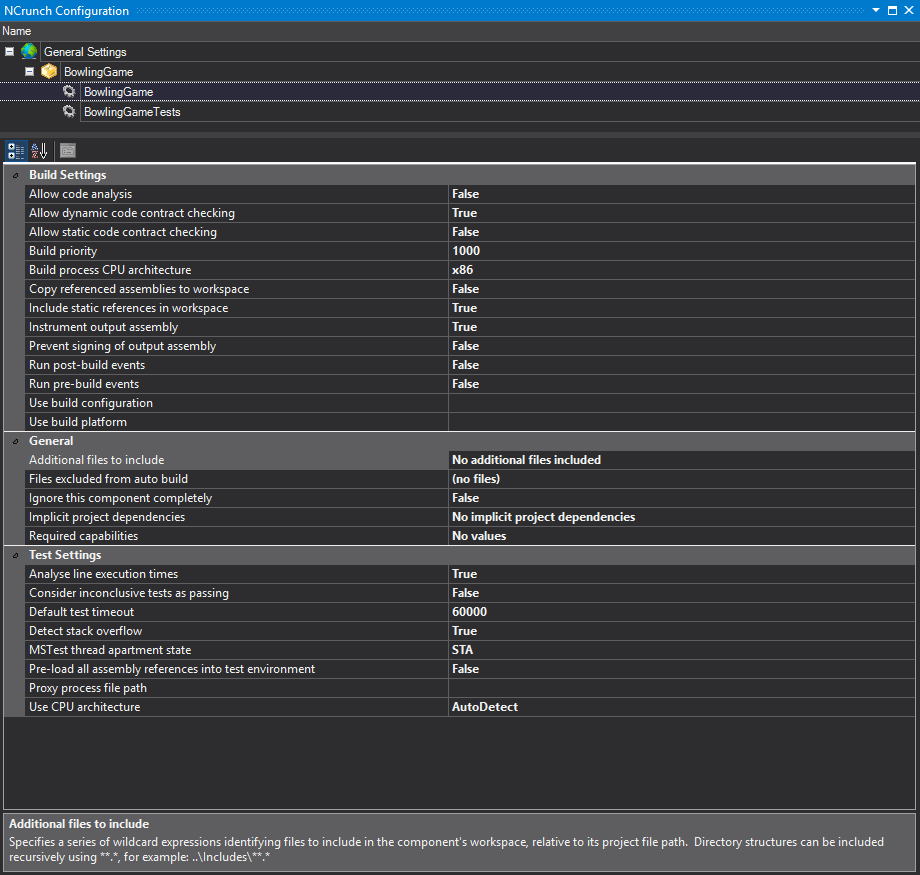
Constant background compiling and test running obviously requires some significant computing resources. Fortunately, NCrunch is super-configurable in this regard. It’s easy to specify such things as the number of CPU cores that should be assigned to NCrunch, and the maximum number of processing threads. Not all the tests have to be run continuously – tests irrelevant to the work being undertaken can be ignored, or NCrunch can intelligently execute only those tests it determines are affected by changes.
Today I was working on a small corner of a large .NET solution (60+ projects), so I deliberately told NCrunch to ignore most of those compo
nents entirely, leaving it free to devote all its attention on the few assemblies I was currently enhancing. This resulted in faster feedback, saving me time!
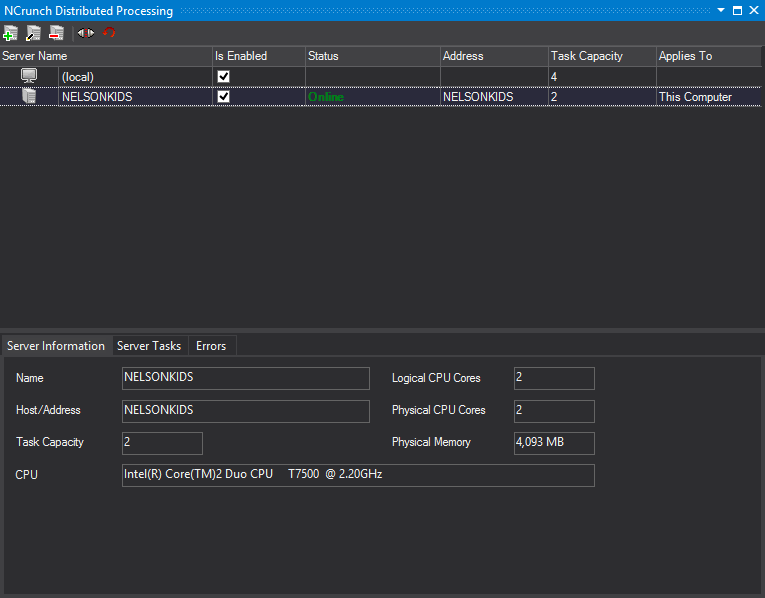
NCrunch Lets Me Utilise Other Computers’ Resources
The latest version of NCrunch even lets me utilise the resources of any other computers or VMs that I may have at my disposal, enslaving them into my army of code compilers and test runners – buwahahahaha!
In the screenshots below you can see that I’ve sneakily added my kids’ laptop as another node in my NCrunch cluster, to offload some of the work from my development machine.
What More Can I Say?
NCrunch rocks. It has spoiled me for IDEs that don’t offer continuous compilation and testing functionality. The effortless manner in which it gives me feedback on the code and tests that I write every day is one of the things that keeps me interested in improving my .NET development skills after well over a decade at the code face.
Disclaimer: Ian Nelson has not received any incentive or inducement to publish the commentary above. I have no material connection with Remco Mulder or Remco Software, other than as a paying customer of the NCrunch product. Some of the links in this post contain my Amazon Associates ID, and I may receive commission if you make a purchase through them.