The inimitable Ayende Rahien is close to releasing version 1.0 of his NHibernate Profiler tool, and it really is shaping up to be a rather lovely little addition to my developer toolbox.
In much the same way that we can use SQL Server Profiler to monitor database activity, and ANTS Profiler to monitor the performance and memory usage of .NET applications, NHProf profiles the activity of the data access layer (NHibernate), and even goes as far as providing helpful hints for potential improvements.
NHibernate is powerful object relational mapper, but has a (perhaps deserved) reputation for having a steep learning curve. One of its major benefits is that it abstracts away much of the drudgery of writing data access code from the developer, but as an unfortunate side effect of this it can make it easy to create inefficient data access layers.
NHProf aims to reduce this risk by providing:
Cognitive application awareness.
Visual insight into the interaction between your database and application code.
Analysis and detection of common pitfalls when using NHibernate.
Sounds good, doesn’t it? So what does that mean in practice?
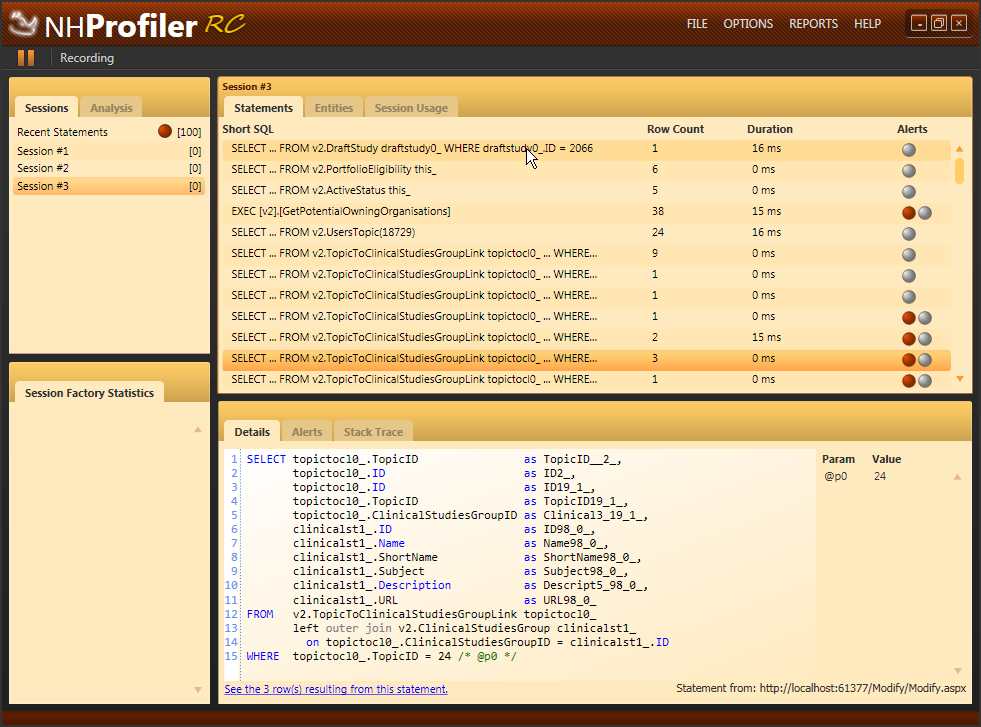
Here’s a screenshot of the release candidate. Note that the Session Factory Statistics functionality is disabled in the current build.

Each profiled NHibernate session can be selected individually from the pane in the top left, and from there we can drill down to see the details of each SQL statement executed against the database (formatted in nice readable manner), along with details of any parameters, and even an option of viewing the rows resulting from the statement.
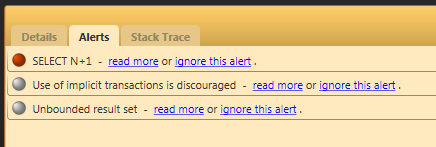
The statements are interpreted, and suggestions and warnings are flagged as alerts, along with hyperlinks to online guidance explaining how the data access can be improved.
A stack trace is also provided for each statement, allowing us to identify the code that caused the data access to occur. It’s possible to double-click on a row within this trace to jump straight to the code in Visual Studio.

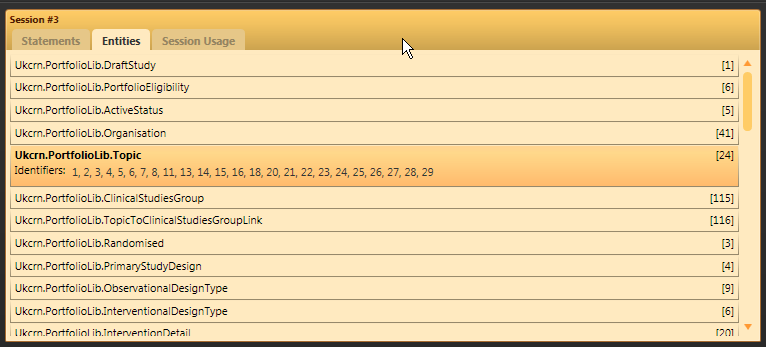
In addition to showing the SQL statements executed by each session, details of the entities loaded by each session are also given.
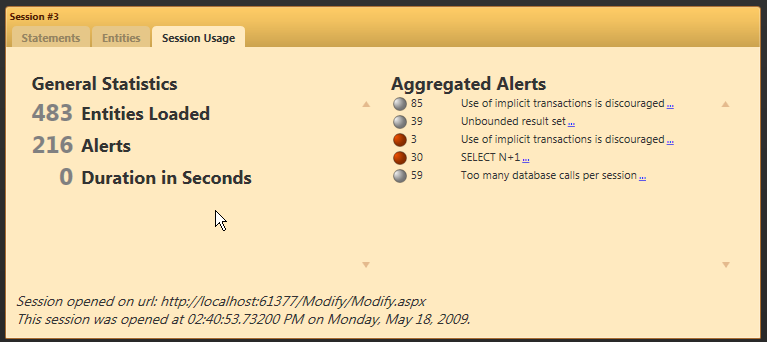
…and there’s a summary of the NHibernate usage for each session.
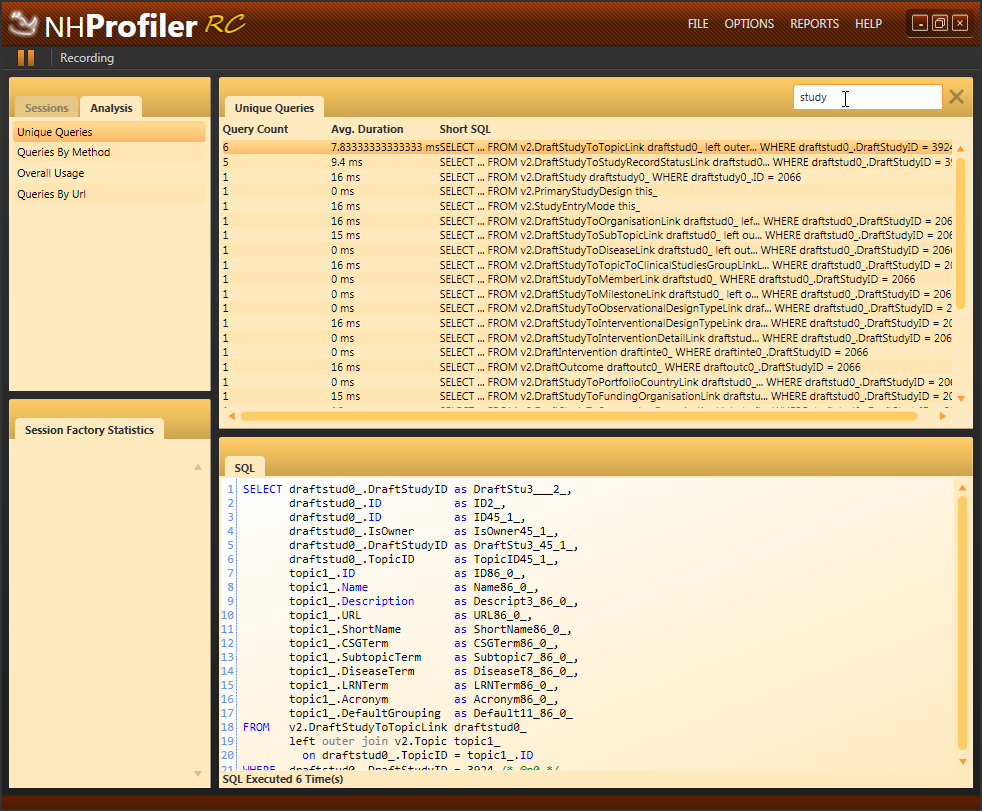
As well as providing session-by-session detail of what’s happening, NHProf allows us to analyse the overall activity. Here, I’m looking at unique queries containing the string “study” (note that differing parameters don’t count towards “uniqueness”):
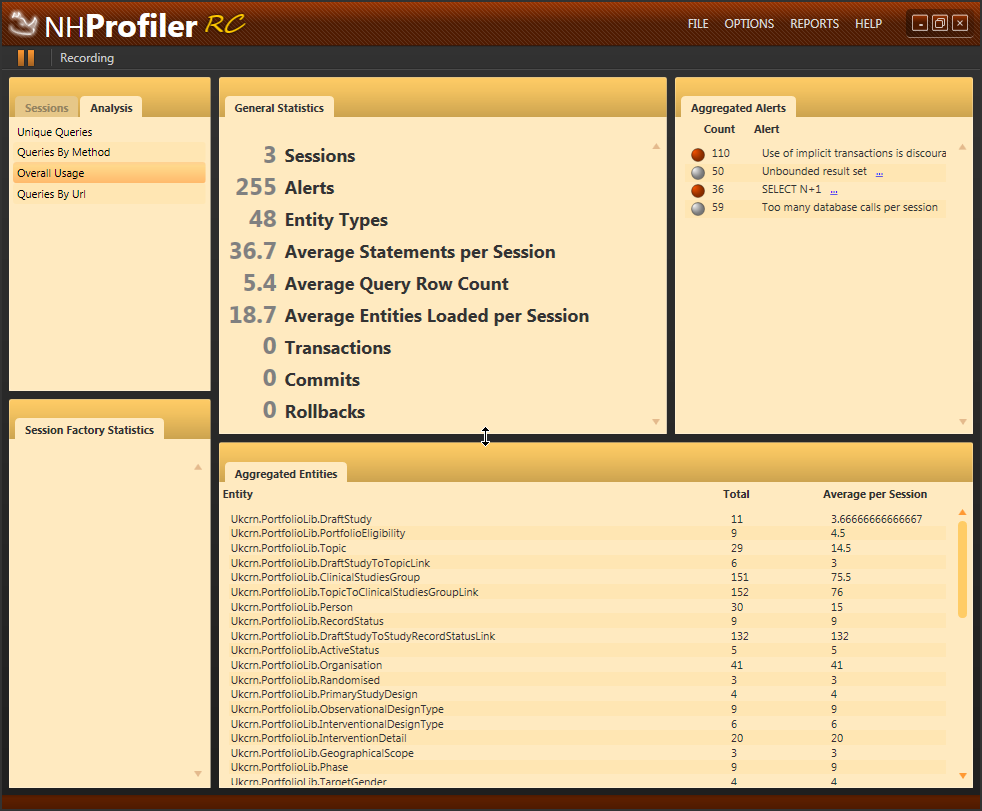
We can also obtain analysis by Method, Url (for web applications) and Overall Usage statistics:
In my opinion NHProf has the potential to become an essential tool when creating or maintaining a solution which leverages the power of NHibernate. In addition to highlighting performance and other issues, it is a great aid when learning about NHibernate, or when familiarising oneself with an inherited solution. Overall, it’s the next best thing to having Ayende sat by your side lending a guiding hand.