Fifty-three years since Darrell Huff published the seminal How to Lie with Statistics, and still we have newspapers as august as The Times pulling the oldest trick in the book:
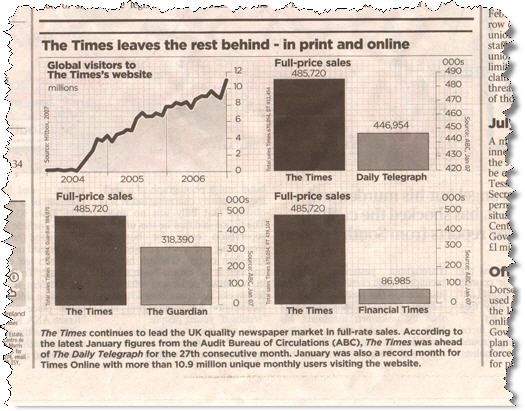
At first glance it all looks very impressive, but closer inspection of the comparison with sales of the Torygraph reveal a mere 8.7% sales lead, not more than double as suggested by the graphic. Not fooled.
Another favourite book of mine that covers the still-relevant topic of graphical integrity is Edward Tufte’s The Visual Display of Quantitative Information. It’s one of those timeless works that I look forward to sharing with the next generation.